GA4 is Google’s only data tracking tool as of July 1
Yay! Google’s UA -> GA4 transition day is finally here. As of July 1, Universal Analytics (UA) will no longer track data. It had a good run: October 2012 to June 30, 2023.
Double check your data is tracking
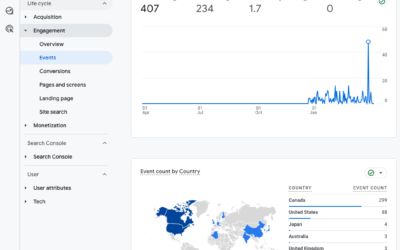
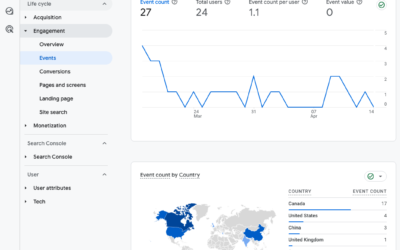
Take 5 minutes to do a final check—before July 1—to ensure your GA4 data is tracking.
- Log into GA4.
- Is data is tracking?
- Check your settings. Here’s the implementation checklist with details.
- Confirm you have conversions marked.
- Are there any events missing?
- Check your integrations. Have you linked Google Ads? Confirm you are bidding on the right conversion goals in Google Ads. Have you linked Search Console? Have you linked BigQuery (if you never plan to use it then this is optional)?
- Is your ecommerce tracking as expected? Before the UA data disappears, compare your transaction and revenue numbers.
Plan your backup
You will be able to log into UA and look at historic data until July 1, 2024. Initially Google said that account users would have only 6 months but they have extended that to one year. Phew.
Please know that there is no one-click backup or export button for UA. So what are the options?
1. Access UA data until July 1, 2024 and then forget about it. This is a good option if you never really look at the old data anyway. Con: When it’s gone, it’s gone.
2. Manually export reports. Find your favourite reports and then download to PDF, CSV, or Sheets. This is a good option you want to save a few reports and you don’t really need to dig into secondary dimensions or custom reports for multiple timeframes. Try exporting a report and see if it gets you what you need. Typically if you set up two metrics in the line graph then those will export with a daily count; and the table of data will export what you see on screen for that timeframe. Con: This can be time consuming if you have a lot of reports, some reports will use sampling (only a subset of data), and you can only export 5000 lines at a time.
2. Export tools. These tools use the Google API to export the raw data logs. If you need long lookback periods (i.e., how has traffic trended year over year from 2018 to date, how does this holiday period compare to last or vs. pre-COVID), then you’ll have to export the data. Con: Exporting raw data requires strong knowledge of the UA dimensions and metrics required to construct the reports. Calculated metrics are best not exported but calculated after, like ecommerce conversion rate. User metrics are also specific to a time period so exporting user tables for different periods (daily, weekly, monthly, yearly) is required since they cannot be summed. For example, if I visit your website today then I am recorded as 1 user. If I return a few days later, then I am still the same user. In the log files, I am counted as a user on my first visit and I am a user on my second visit. These cannot be summed. I’m not two users. I am 1 user. So you have to be mindful of the reports you output from the raw data because you could be combining data that should not be.
Need an export tool? The best export option is Analytics Canvas at $99 USD, which gets you 10M rows of data.
Analytics Canvas offers some predefined tables to export, which can be easily modified. The challenge is familiarity with the final reports you need and understanding the granularity required. Each secondary dimension you include increases the number of rows of data so you can easily surpass the 10M rows and that will cost you more.
Analytics Canvas offers UA export to BigQuery, CSV, or Google Sheets. If you are familiar with BigQuery, then you probably have a lot of this sorted out already. If you have never used BigQuery then, yes, you can export your UA data to BigQuery, but how will you use and access that data? If you’re a less technical user then the CSV export is going to be most useful as a backup. In that case, you really need to think about the reports you want to run and how skilled you are at pivot tables, vlookup, and other advanced functions.
Thankfully, you have 1 year to figure out exporting that backup, or if it’s even needed.
Need some reporting tips? Check out our previous Google Analytics posts.


