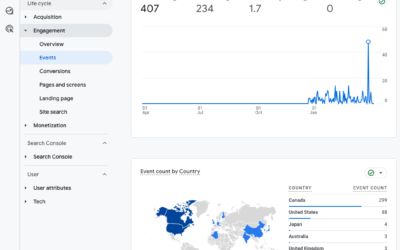
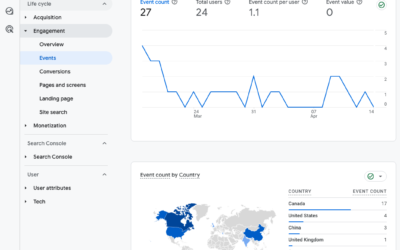
Google Analytics’ Annotations feature is a really useful tool that doesn’t get used as much as it should. It’s an easy feature to apply and it’s great for measuring the success of your marketing campaigns because it creates an activity timeline that positions your marketing activities in relation to your website traffic.
How To Set Up Annotations
- Sign in and view your analytics report
- In the Dashboard under the main graph, there’s an arrow tab, click on it.
- The tab should expand and reveal a “Create new annotation” link.

- Click “Create new annotation”. A field should appear.
![]()
- Enter the date and description of your marketing activity.
- Choose whether to share the visibility of the annotation with other members of the account or keep it private.
- Click Save.
- You can also create an Annotation by clicking on a date on your Dashboard graph. A bubble will pop up, click Create new annotation.

Now when you look at your Dashboard with the arrow tab opened below the graph you’ll see a list of your marketing activities. You’ll also see little activity bubbles on your graph to indicate that an activity happened on that day.

How To Use Annotations in Your Marketing
Annotations are extremely useful for creating benchmarks and measuring and tracking your marketing campaigns. For example, say you held a contest on Twitter from May 10th to May 20th. If you enter both these dates as Annotations you can quickly and easily see how the contest affected your site traffic—and if it had any long lasting affects. Plus, if you have advanced segments setup, you’ll be able to see where this traffic came from and how your traffic sources were affected by the contest.
The most useful feature of Annotations is that they last for as long as your account exists. This means that if you want to hold another Twitter contest next year, you can look back on your numbers from last year and set a baseline for what to expect from the campaign this year. Once the contest is finished, you can compare how the contest fared in terms of site traffic in relation to last year.
We’re always looking for more ways to measure our online marketing activities and Annotations is an easy tool to do just that.
More Google Analytics Resources:
How to Use Google Analytics Advanced Segments NEW Version
How to Use Google’s Advanced Segments OLD Version
How to Get Analytics Reports Sent to Your Inbox
How to Give Someone Access to Your Google Analytics


