If you are new to Google Analytics, then understanding the monthly Google Analytics Report can be a challenge. Here’s a breakdown of a standard monthly report and what the numbers mean.
The Dashboard
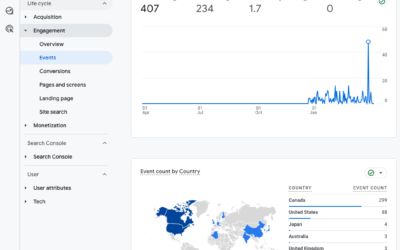
The Dashboard gives you a quick summary of the entire report. Most stats you want to see are here. The gird shows you traffic patterns throughout the month. The blue line represents the current month traffic and the green represents the past month. If you see a big spike in traffic, look back and see what was going on that day to increase visits to your site.

Visitor Overview
This section gives you an overview of visitors to your site and their level of engagement. The green or red percentage tells you how the numbers compare to the previous month. Key stats to look at:
- Absolute Unique Visits shows you the number of non-duplicate visitors to your website over the course of the month. This is the actual number of visitors to your site.
- Average Pageviews shows you whether or not your visitors are engaging with your site. An average of 3-4 Pages per Visit is good for most information websites. (Pageviews is the total number of pages that visitors viewed during the month.)
- Average Time on Site tells you how long visitors are spending on the site. Aim for 2-3 minutes.
- Bounce Rate shows whether visitors are spending time on your site or are landing on your webpage and immediately leaving. If the bounce rate is well over 50%, investigate why. Are people not finding what they need?

When looking at these numbers it’s important to look at them in relation to each other. If you’re getting a high number of pages viewed per visit but a low average time on the site, for example, visitors are clicking around a lot because they are not finding what they are seeking. In this case, a high number of pages viewed per visit isn’t necessarily a positive number.
Traffic Sources
Traffic comes to your website from 3 sources: direct traffic (visitors who navigated directly to the site by entering the URL into the browser address bar), referring sites (visitors who navigated to the site by clicking on a link external from your webpage) and search engines (visitors who navigated to the site by clicking on search results for your site).

Traffic sources are important because they show how people are discovering your site.
For people coming from search, it’s important to see what keywords they’re using to get there. If familiar keywords are seen month over month, then it indicates a strong interest in a topic or category, which you may want to profile on the home page. Trending keywords should also be used in your site content, for example, as blog posts and page titles, in order to capitalize on new traffic sources.
For people coming from referring sites, it’s important to see what those sites are. Referrals or links from other webpages to your site are lead generators and are valuable because they are essentially recommendations. You want to build a relationship with the sites that are directing traffic to you.
Content Overview
This section shows you what pages users are visiting on your site, for example: /members. Pages that receive a high number of visitors should be prioritized—if your users feel that these pages are interesting and informative, then you should pay attention to the content and how easily those pages are to find then make any necessary improvements.

Map Overlay
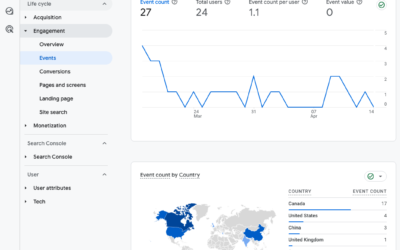
Map overlay shows you where your visitors are geographically. This is important if you’re trying to target a a specific geographical area.

By setting up a Google Account, you can also log into Google Analytics and run various reports, change the date timeframe and dig deeper into each of these overview reports.


