GA4 has some great features, but it also has limitations that drive users to the Explore feature where they can use various dimensions, metrics, and segments not found in the standard reports. That is great, but if you’re relying on GA4 Explorations for your reports, it’s important to understand how data retention settings differ between Standard reports and Explore reports.
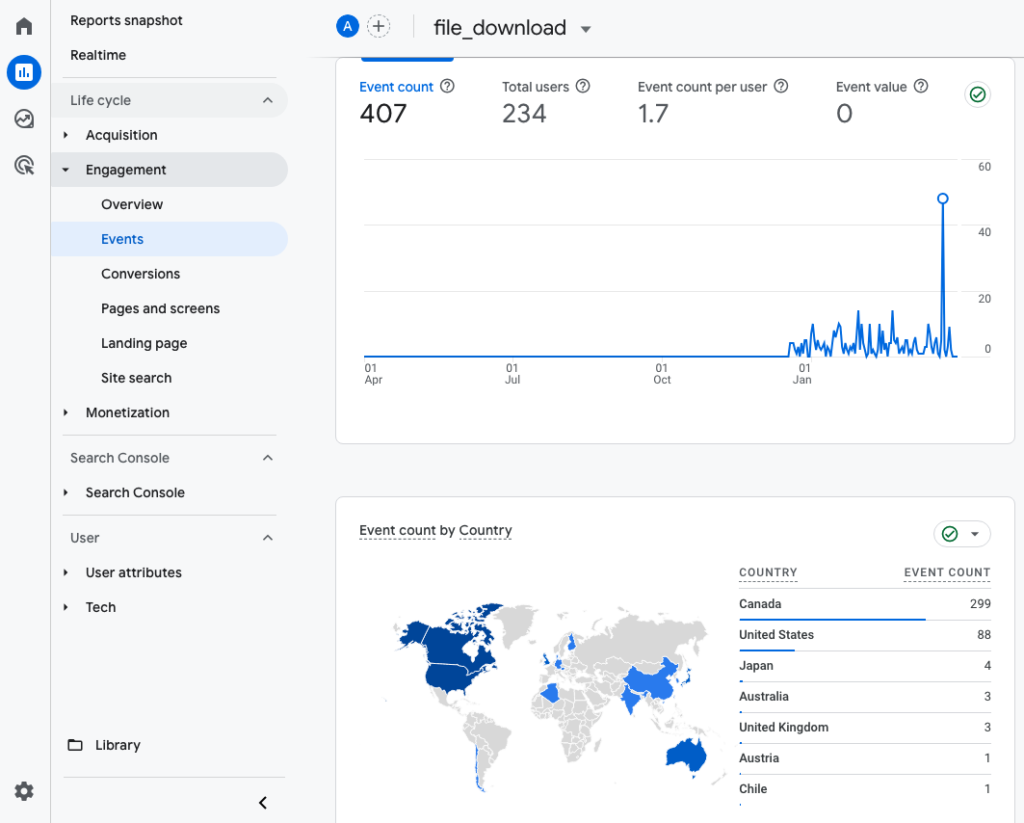
Note: Standard reports are accessed in the left nav under Reports whereas Explore is it’s own section. The image above is showing Standard reports.
Aggregated Data vs. Raw Data
Standard GA4 reports use aggregated data, which is easier and cheaper for Google to store. This allows you to access data from the entire period you’ve been collecting it, making standard reports consistent and reliable.
Explore reports, on the other hand, use raw data because they involve complex, user-defined combinations of metrics and dimensions. This reliance on raw data can sometimes result in discrepancies between the numbers in standard reports and Explore reports.
Data Retention Policies
The difference in data retention is crucial. Standard reports can include data from the day you started using GA4, thanks to the use of aggregated data. However, Explore reports default to a data retention period of two months, extendable to a maximum of 14 months. If you need historical data beyond this period, Explore reports won’t suffice.
Solutions
- Use Standard Reports, or Customized Standard Reports: Whenever possible, use the standard reports, or modify a standard report to include the dimensions and metrics you need instead of using Explore. See the instructions on how-to create a customized standard report for file downloads.
- Utilize BigQuery and Looker Studio: Export your data to BigQuery and use Looker Studio or another reporting tool to recreate your reports. This ensures you retain access to your data long-term. I recommend you sign-up for free access to the tools at MeasurementMarketing.io then view Toolbox > Linking Google Analytics to BigQuery Guide.
Storing your data in BigQuery provides a backup, ensuring you don’t lose valuable historical data. I recommend you sync GA4 with BigQuery regardless of whether you ever use the BigQuery version. The instructions above from Measurement Marketing will guide you through the correct way to do that. To actually build LookerStudio reports using BigQuery, I highly recommend a tool like AnalyticsCanvas, which will write the prompts for you. If you experiment on your own, you can run up quite the bill.
Using BigQuery is not for everyone. But by understanding the differences in data retention between standard reports and explorations, you can avoid the pitfalls of data retention issues in GA4 by learning how to customize your standard reports.
Give it a try — Customize a standard report
For example, the standard report for Events > file_downloads may show you some scorecards or widgets that aren’t as useful as you’d like. Perhaps you want a table of data showing filename and number of downloads per file? It’s possible to create this in Explore, but it’s even better to go to Library > Create new report, and to build a file_downloads report using the standard report.
TIP: Go to the Events report and click the pencil icon in the top right to customize the report. For dimensions use File name and File extension, for metrics use Event count, Total users, and Event count per user. Save the customized report under a new name and then in the Library add it to the appropriate section so the report is viewable in the left nav. This tip assumes you are using GTM to send the file_download event, along with the relevant parameters.