Measuring the value of your marketing efforts is a constant struggle for businesses because there are so many factors that indirectly affect sales. On top of that, online marketing can drive offline sales and offline marketing can drive online sales. All of these factors make it difficult to really know what is influencing a sale. That said, Goals and Custom Reports in Google Analytics can give you insights into the two things that the people holding the marketing purse strings care about:
- Sales
- Things That Lead to Sales
Sales are the macro conversions—the big hairy, totally awesome goal—while “Things That Lead to Sales” are the micro conversions—the precursors to a sale. These micro conversions have a non-financial impact (gaining a new Twitter follower, a Facebook like, a new email subscriber) but they are all the things that help us understand what influences a purchase decision. That’s why when it comes to conversions, you want to follow Dave McClure’s advice and think like a pirate—AARRR!
|
THINGS THAT LEAD TO SALES |
|
|
Acquisition: How did visitors get to your site (search, referral, direct), how many visitors came from each source, did they bounce? Activation: What are your visitors’ on-site behaviours: number of pages viewed? Repeat visits? Do they sign up (newsletter, email, membership, subscription)? Do they/are they a social media fan or follower? Retention: Do you capture their attention (email opens, click throughs)? Does your content keep them interested (repeat visits)? Referral: Do your visitors love you so much they tell other people about you? Blog and media mentions, retweets, +1s, social sharing? AND, do they tell other people who then also sign up, like, follow, refer, buy, etc.? |
|
|
SALES |
|
| Revenue: Do they buy from you? | |
Setting up goals in Google Analytics provides an easy way to track sales, especially if you are using Goal Funnels.
What’s a Goal Funnel?
A funnel represents the path that you expect visitors to take on their way to converting to a sale. It’s a defined set of steps or pages in the checkout process. For example, I view My Cart. I click Go to Checkout. I Complete My Order. A Goal Funnel shows the funnel conversion rate, as well as the points along the path where a visitor abandons the task. Funnels are important for non-ecommerce goals as well, such as email newsletter signups or whitepaper downloads. Goals and Goal Funnels will tell you the conversion rate for the macro goal so you can do some forecasting and they will help you understand what steps in the process need to be optimized.
Once you have Goals and Goal Funnels set up in Google Analytics, then it’s time to create some Custom Reports that will tell you even more information about those micro conversions—things that lead to a sale—like website visitors, time on site, number of pageviews, sign ups, click throughs, repeat visits and referrals.
Setting Up Custom Reports
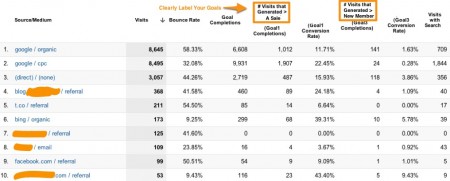
I call this my “What Does Success Look Like” Report because it quickly tells me what channels generate the most conversions and the most valuable conversions, as well as the conversion rate, and the bounce rate for my various marketing channels. You can see in the example report that the Goal Completions number only tells part of the story, whereas Goal Completions + the Goal Conversion Rate provide greater insight into which channels could be better leveraged.
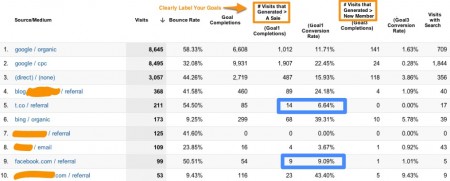
Above you can see that Facebook generated 9 Sales and Twitter (t.co) generated 14 sales. Instead of making a judgement based only on Goal Completions, and assuming that Twitter is the better performing channel, you can look also at the Conversion Rate. Facebook traffic converts at 9.09% whereas Twitter only converts at 6.64%. The Site Performance Report would suggest that a little experiment is in order. If you can double the Facebook traffic, will the conversion rate stay the same? i.e., instead of 99 visitors a week from Facebook, could you get 198 visitors and therefore 17 sales? Of course, there are many factors, such as time, to also consider, but the point is that using only 1 data point limits your view of the opportunities.
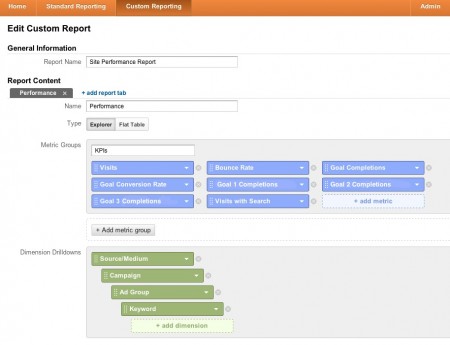
How Do You Set Up a Custom Report in Google Analytics
- Log into Google Analytics
- In the top navigation, click on Custom Reporting
- Click New Custom Report
- Label your report and name the report tab
- Click on the blue Add Metric box to add your KPIs (key performance indicators) and select the relevant fields from the dropdown menu. These metrics will make up the columns of your grid.
- Click on the green Add Dimension box to create a hierarchy or drilldown structure. For example, if you are running a banner ad campaign, you may want the top-level reporting to show that the source/medium is referral traffic from the National Post, but if you have more than 1 banner image/copy, then you may want to drilldown to see what ad specifically is sending traffic to the site. Same with Google Adwords campaigns, you may want to see what Campaign, Ad Group and Keywords are performing best.
- Save your report.
Or, let me make it easier for you: Log into Google Analytics and click here to get this Custom Report Configuration.
You’ll be prompted to select a Google Analytics profile then the report will appear in the Custom Report tab for that profile. You can then click Edit to adjust the report to include the Goals relevant to your site.
As online marketing continues to mature, it’s even more important to understand how to extract the social metrics and business metrics from Google Analytics in order to understand the value your marketing activities have on the business’ financial health. Be ready next time your manager asks if you know what’s working.
Step 1: Pick Good Goals
Step 2: Set up Goals in Google Analytics
Step 3: Create a Custom Report
Step 4: Experience the Awesome
Related Articles:
- Unsure of what goals to track? See the slides and audio from my BookNet Canada presentation “Beyond Fans and Followers: Measuring Your Online Marketing Campaigns,” which looks at the key performance metrics for a variety of common campaigns like running a contest, doing a discount promotion or reaching out to influencers.