Publishers of all sizes are working to the best of their abilities with limited resources. So, when it comes to Google Analytics, why waste time looking at data and reports that don’t provide actionable next steps? Instead focus on a few metrics that make sense for your business and identify marketing opportunties, shortcomings or visitor insights.
Acquisition of Traffic to the Site
Instead of looking at the total number of visits to your site, review the traffic volume by source in relation to conversions.
This requires you to have set up Goals and Custom Reports.
But assuming you are awesome like that, you now have a quick way to see what sources are bringing the most traffic to your site but also which of those sources is most valuable to you in terms of conversions (desirable actions on your site, like ecommerce transactions, newsletter signups or downloads).
If you want to take this one step further, then obsess about Cost Per Acquisition. If you are paying for Google Adwords, then a CPA column can be added to your custom report, but if your focus is SEO or social media, and especially if you are paying someone for that service, then you want to export that Custom Report to Excel and calculate how much it is costing you to get that traffic and whether those costs are worthwhile. Do not forget Email Marketing! If you are paying for Constant Contact or MailChimp, that is a cost.
Behaviour Onsite
In a retail setting, for example, there are visual and verbal cues that tell you someone is interested in an item or just browsing. Online the cues are harder to interpret. Did the person look at a lot of pages because they were interested? Or could not find what they wanted? Did they spend a long time on the site because they were actively reading the content or did they just leave that window open and are now on the phone?
Bounce Rate at least identifies when you have attracted the wrong people or the right people but to the wrong page. Look at this metric, especially if you are creating campaign landing pages.
Remember that Custom Report? This is your other favourite friend, especially if you included the column for conversion rate. Look at the above metrics for volume of traffic by source, bounce rate, number of conversions AND now conversion rate in order to understand as much of the context as possible behind each individual metric.
Conversions (or Desirable Action)
Don’t just look at the outcomes! You might have 100 ecommerce transactions or 30 new newsletter signups, but how many did you lose?
Abandonment Rate is the percentage of people who start down a desired path but do not complete the sale, signup or other action you are tracking.
The thing about Google Analytics is that it will tell you what is working or not working, but not how to fix it. Assuming there are multiple steps to a process, like moving from confirming an order to providing shipping and billing details to final order completion, look at the abandonment rate at each step and focus on the steps with the highest abandonment. Turn to your designer, online marketing expert or a third party conversion optimization expert to identify improvements for that step or landing page.
Aside from our own conversion audit, feel free to ask for details, we highly recommend the SiteTuners Express Review or Express Fix for Small Businesses.
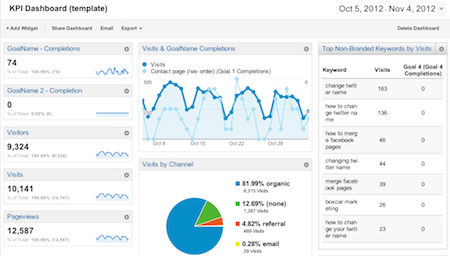
Want My Google Analytics Custom Report?
Click here and follow the prompts to add my Custom Report to your Google Analytics profile.
More Google Analytics Resources