Test Your Google Analytics IQ
School is back in session! Can you pass this back-to-school test? Sharpen your skills. See if you know how to access these Google Analytics insights related to website performance.
Time to upskill your Google Analytics knowledge? Test your Google Analytics IQ and sharpen your analytics skills by digging into these Google Analytics insights related to website performance.
1. How many people visit your website per month?
Google Analytics > Reporting > Audience > Overview
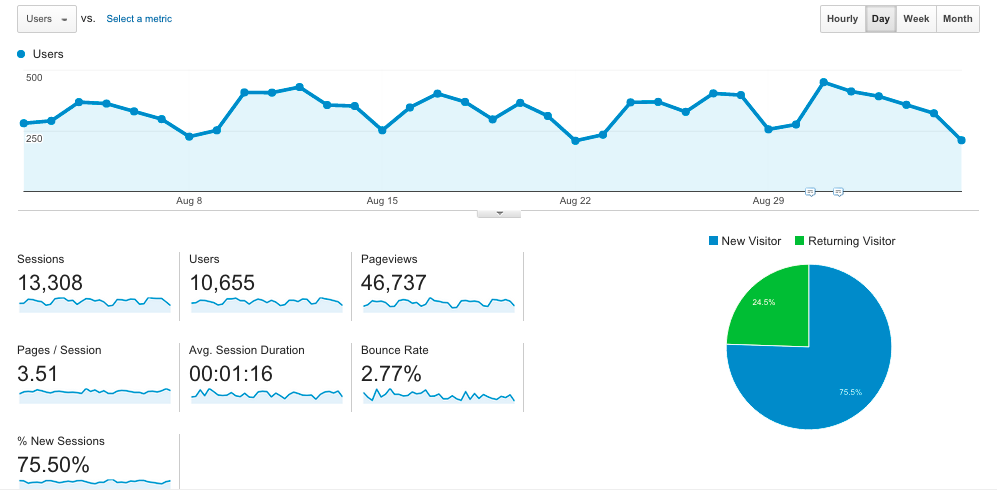
Look for the “Users” number to see how many people visited your website in any given time period. The Google Analytics date range often defaults to the last 7 days, but clicking on the date range in the top-right corner of the report lets you adjust to any desired date range.
What do those terms mean?
- Users are visitors.
- Sessions are the number of visits that users make to a website.
- Pageviews are the total number of pages that were viewed.
- Pages / Session is the average number of pages viewed in a visit.
- Avg. Session Duration is the average length of a visit.
- Bounce Rate is the percentage of single-page visits (i.e. the user viewed only a single page then left the site).
- % New Sessions is an estimate of the percentage of first-time visits.
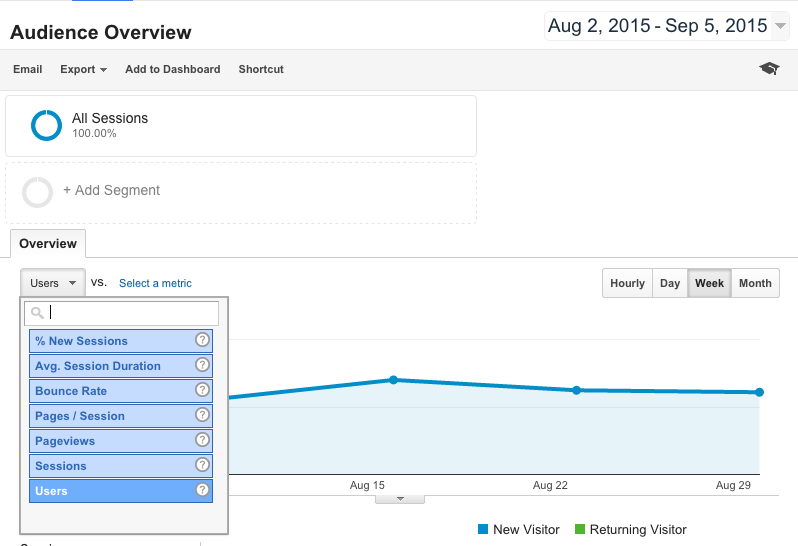
The line graph on this report, by default, shows the number of Sessions. To change it to Users, click on the button under the Overview tab and select Users from the dropdown menu.
How does your website perform?
- Active book publisher websites often have 10-15,000 users per month.
- Moderately active publisher sites have 2-5,000 users per month.
- And limited activity sites have less than 1,000 users per month.
2. Is your site mobile friendly?
Audience > Mobile > Overview
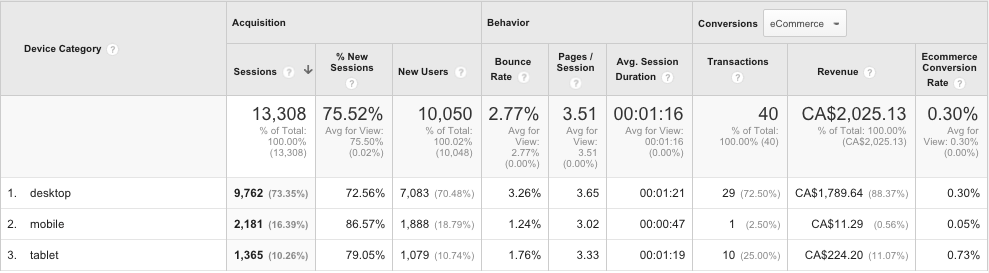
Your website is mobile friendly if the behaviour and conversions of the mobile and tablet traffic are in line with that of the desktop traffic.
Look at the middle section of the report, Behaviour metrics.
Does the mobile and tablet traffic bounce at a similar rate as the desktop? Do they view a similar number of Pages per Session? Do they spend on average a similar amount of time? If yes, then the site is mobile friendly, meaning that the behaviour of this audience is similar to that of a desktop audience.
If you have ecommerce, then you can also look at the eCommerce Conversion Rate for mobile and tablet to see the percentage of visits that resulted in an e-commerce transaction.
So, is your website mobile friendly?
Book publisher websites tend to have 30-40% of traffic coming to the site via mobile (iPhone, primarily) and tablet (iPad, typically).
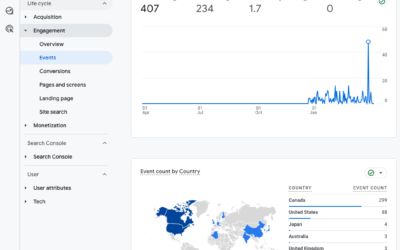
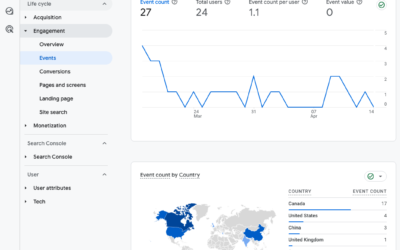
3. What websites send the best traffic to your website?
Acquisition > All Traffic > Source/Medium
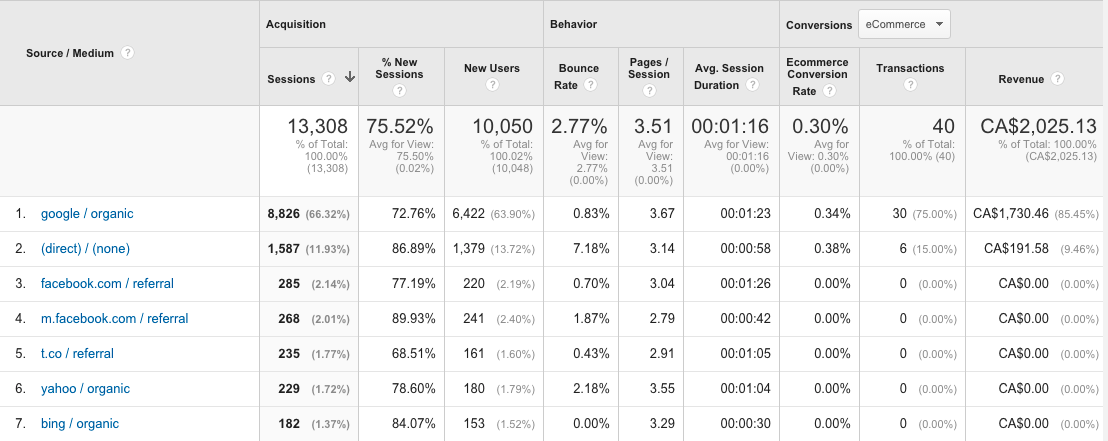
The All Traffic report > Sources / Medium shows the number of website sessions broken down by source. This is a good way to see how many website sessions are generated by various sources such as Google organic search, people typing in your URL directly, various social media sites like Facebook and Twitter (t.co), as well as media and influencer sites.
The conversions section of the graph (right-hand side) will show ecommerce conversions for each source, if applicable. Click the column headers to sort by the number of Transactions or Revenue to see the top-converting sources.
Many book publishers have more followers on Twitter than Facebook, but their Facebook visitors tend to stay on the site longer and convert at a higher rate. Which social network consumes more of your time? Is it paying off? What impact does Instagram have on conversions?
4. What pages on your website are the most popular?
Behaviour > Site Content > All Pages
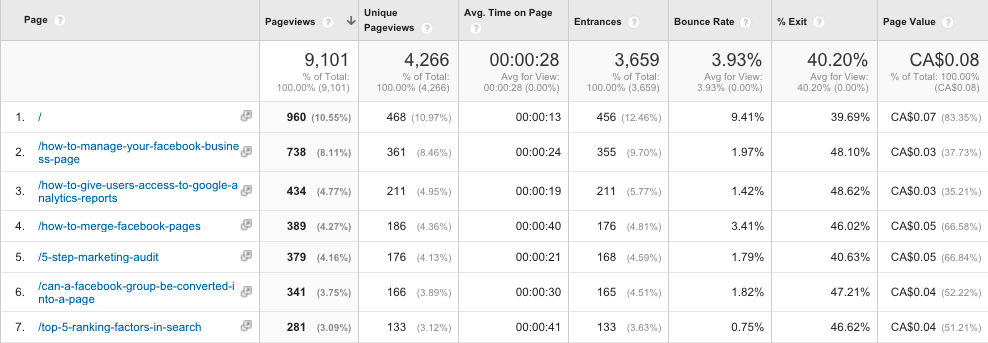
Page Value (far right column) is a measure of influence. Pages with a high Page Value are more influential than pages with a low Page Value. i.e., these pages influence a sale or goal conversion (like a newsletter sign up or download).
Page Value is the average value of the page, which is calculated as follows: (Transaction Revenue + Total Goal Value) divided by Unique Pageviews. In order to use this metric, you must have Goals set up (Admin > Goals) and/or eCommerce enabled.
5. Do you know how to bring these metrics into a single reporting dashboard?
Make it simple. View your most important metrics using custom dashboards. I've made one for you.
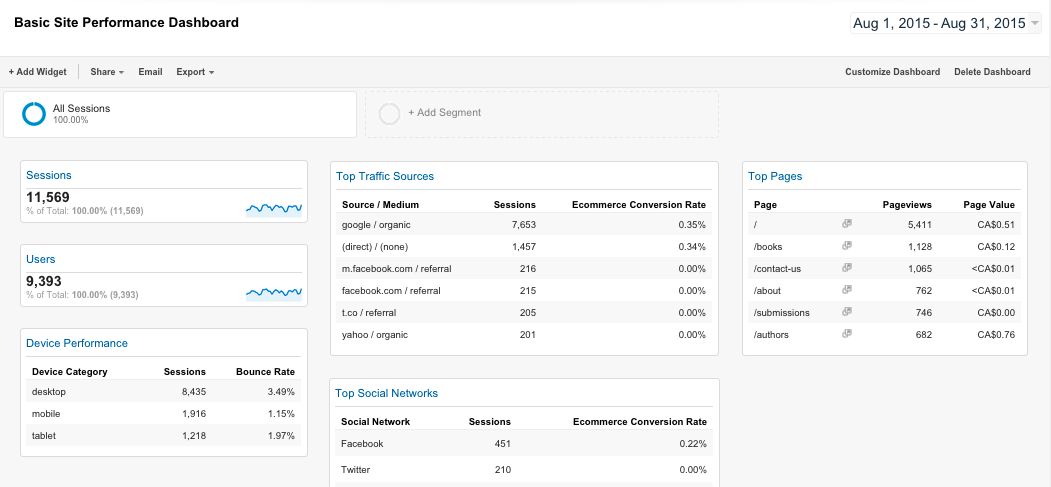
- Log into your Google Analytics account.
- Click on the below URL and choose a view from your Google Analytics account to import this configuration.
- View the Custom Dashboard in Analytics. Each blue heading is a clickable link to the full report discussed above.
Click here to get the dashboard:
https://www.google.com/analytics/web/template?uid=la064d6eSP66GqVClQnztA
In case you missed it: